13
Dec
2018
Simulating Room Modes
Reading Time: 5 minutes
Have you’ve ever heard a pair of loudspeakers (or more) with good bass extension in an untreated room? Walking around the room, you’d notice that some of the low frequencies are not of equal loudness at different spatial positions in the room. This phenomenon is known as room modes.
Although they affect the entire range of frequencies. The effects are mostly audibly perceptible at the low frequencies- up to 100 to 300Hz depending on the dimensions of the room.
This section is slightly theory-heavy and if you want to see the cool stuff first. If you like, you can skip to simulations and pictures.
What exactly are room modes? Room modes are caused by the standing wave effect which is determined by the wavelength of the sound wave and the dimensions of the room.
Imagine a sound wave travelling towards the wall. Upon hitting the wall, it reflects, and the sound wave will bounces back into the room. When the wavelength is twice or multiples of the length of the room, the reflected wave will cause interferences with the incoming wave.
https://www.physicsclassroom.com/mmedia/waves/swf.cfm
The animation above explains the process of the standing wave.
The interferences occur at certain points along the length of the room causing the sound waves at those points to constantly cancel each other out. This results in a reduced Sound Pressure Level (SPL) at those points (points N on the gif).
Since these points are stationary, it gives the impression of a wave standing still. (N.B. SPL is lowest when the pressure is at zero or close to zero (on axis), loudest when pressure is at minimum/maxima). As the reflected wave would have had some energy taken away when it hit the wall, only a partial cancellation occurs in rooms unlike in the animation.
Calculating Room Modes
The simplest method to calculate the lowest frequency room mode is to take the longest dimension of the room i.e. length, l, divide the speed of sound in air (340m/s) with 2 times the length (l) in meters, i.e. f=3402lHz. This only applies to empty rectangular rooms and with the assumption that the walls are completely rigid. Therefore most of the sound energy will be reflected off the wall. To find the next 2 modes, you can use the width and the height of the room. This online calculator from Amroc is a great tool to quickly find out a room’s room mode.
In the real-world application, the above method and calculator tool is only theoretical and often, it’s inaccurate in finding the problem frequencies as many other factors must be considered. Therefore, room modes can be a huge problem when designing a home theatre or a listening room. That’s not entirely true with the technologies available nowadays and it is possible to know how your room will sound even before building it.
At Soundzipper, we use Olive Tree Lab (OTL) to simulate the low frequency response of the room and Ease to auralise the sound of the room in the listening position, amongst many other features.
Simulation- Olive Tree Lab
In this section, we will talk about the application of Olive Tree Lab.
Here, we have a render of a room. The first step is drawing a model of the room to exact dimensions.
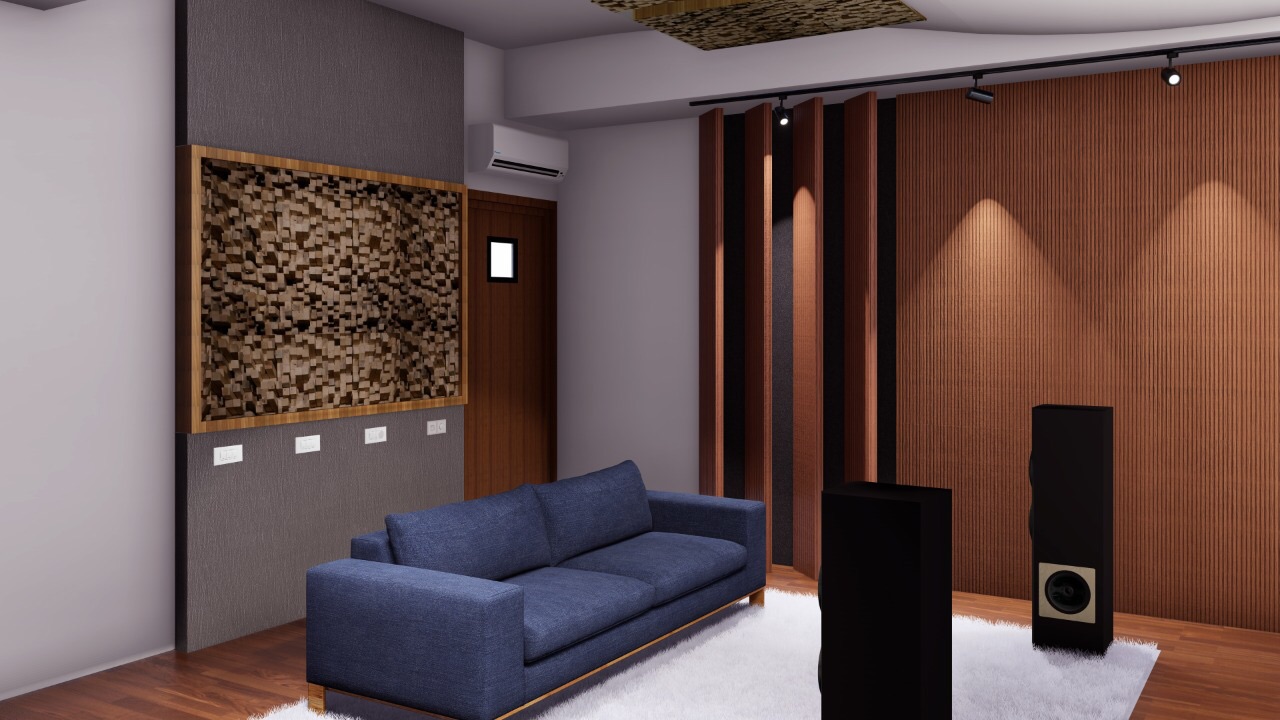
For a simulation model, surfaces that will not be ‘seen’ by OTL should not be drawn and curved surfaces should be simplified into straight lines to make calculations more efficient. All the fancy detailing can be left out. The drawing can be done in OTL or any 3D modelling software, but it has to be exported as an DXF or DWG file.
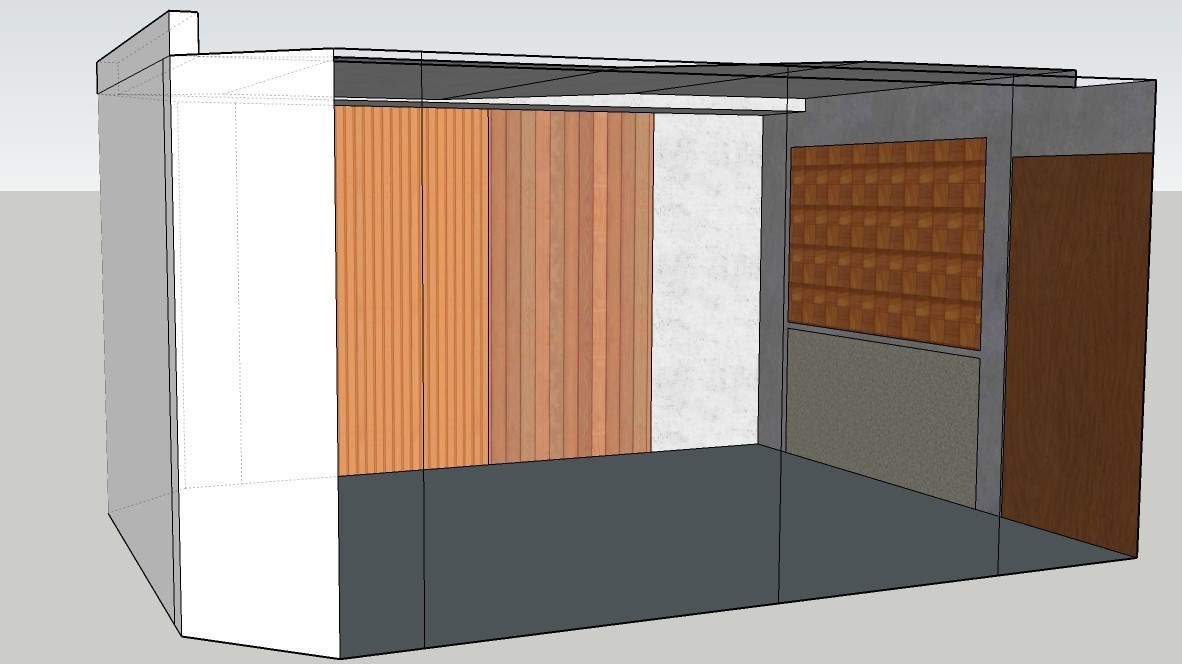
Above is an example of a listening room which has a curved ceiling. Take note of the cut-off corners where the bass trap stands as well as the simplified curved ceiling. The textures are not necessary for simulation.
In the above picture, the model has been imported into OTL. Loudspeakers, listening position and absorption coefficients of the materials and surfaces have been added as well.
Explaining Absorption Coefficients
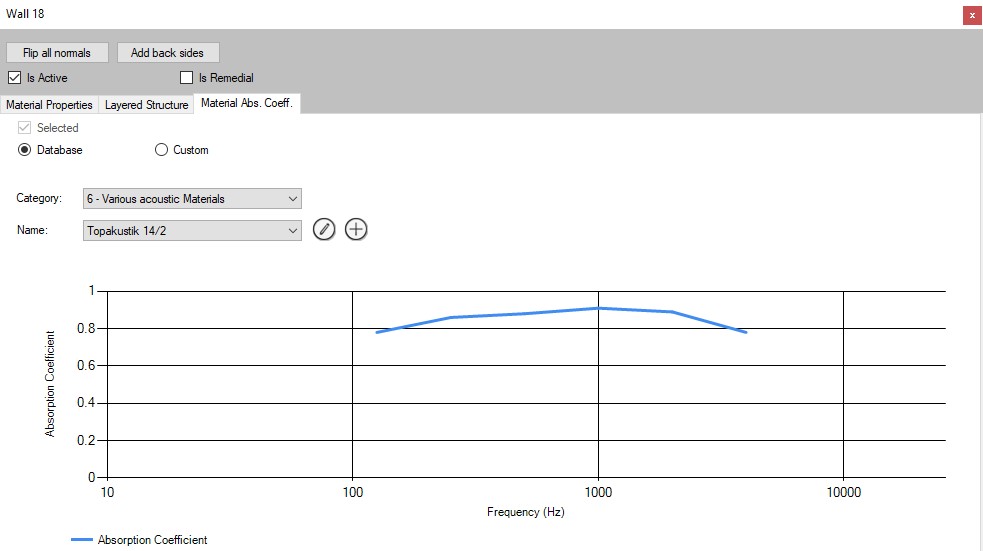
Below is an example of adding absorption coefficients for the material. Absorption coefficients are a numerical measurement of how well a material absorbs sound. This is usually done in 1/3 octave bands (e.g. 63, 80, 100, 125 Hz etc.), and the values span from 0 to 1, with 0 being completely reflective, and 1 being fully absorptive.
Below are some of the calculations that OTL can perform: –
- Ray tracing simulations where it will send out ‘rays’ from the source and calculates how many rays will reach the receiver and at what sound level. (distance and absorption attenuation) From this, it is possible to calculate room acoustic descriptors such as Reverberation Time, Early Decay Time, Clarity etc. These results can help in making a more informed decision on the materials used in the room.
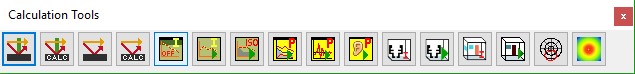
- To see where the room modes are in the room, we can use the 3D mapping in the calculation toolbar. This function allows us to select a certain area and calculate the SPL over the area at the certain height.
- OTL can also perform outdoor sound attenuation- useful in many other modelling instances, but not for room modes application.
Results and analysis
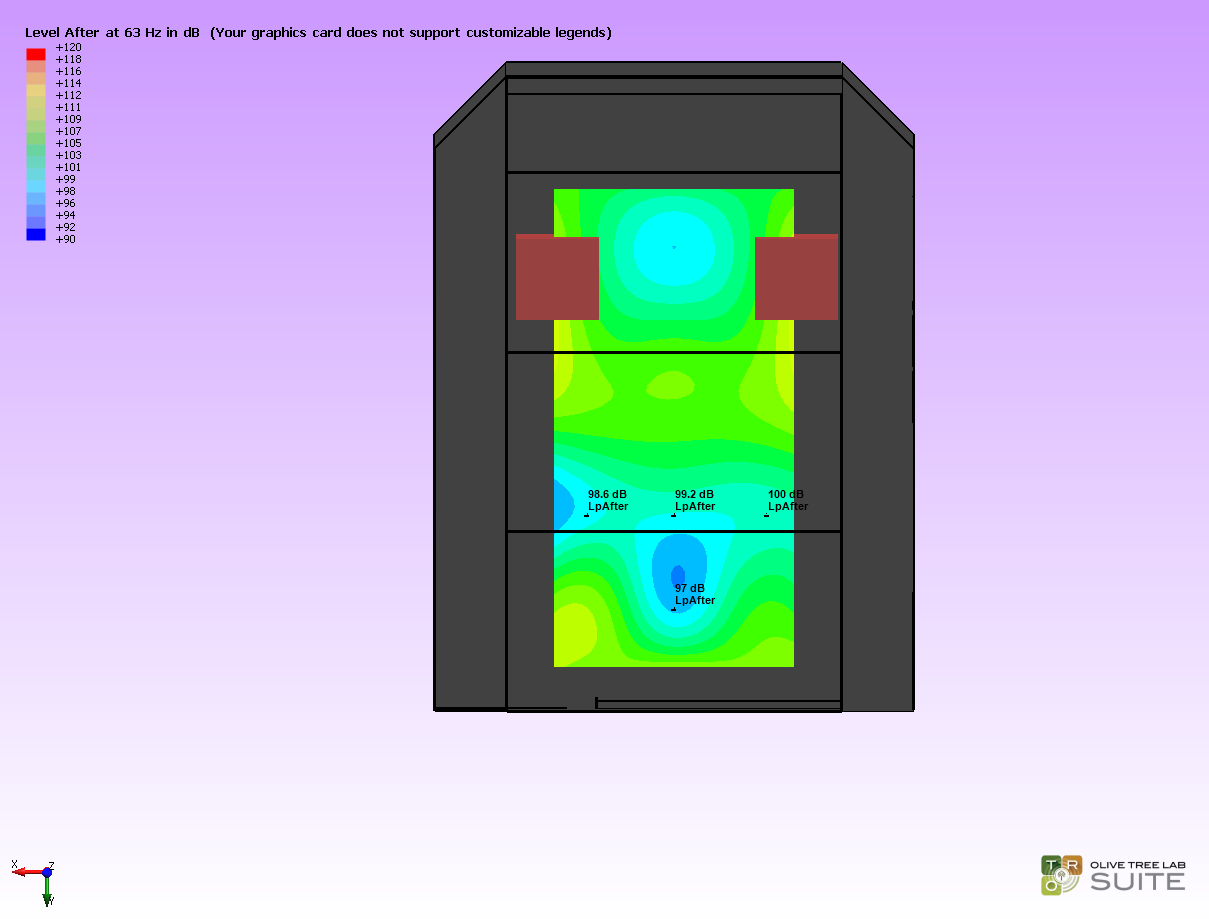
In this case, we want to find out the low frequency room modes of our listening room. Hence, 3D mapping was used. The results shown below have been interpolated and flattened into 2D- 3D is cool, but it’s confusing!
Above are some of the room modes that are present in the room and calculations have also been done to determine the theoretical SPL at the middle listening position.
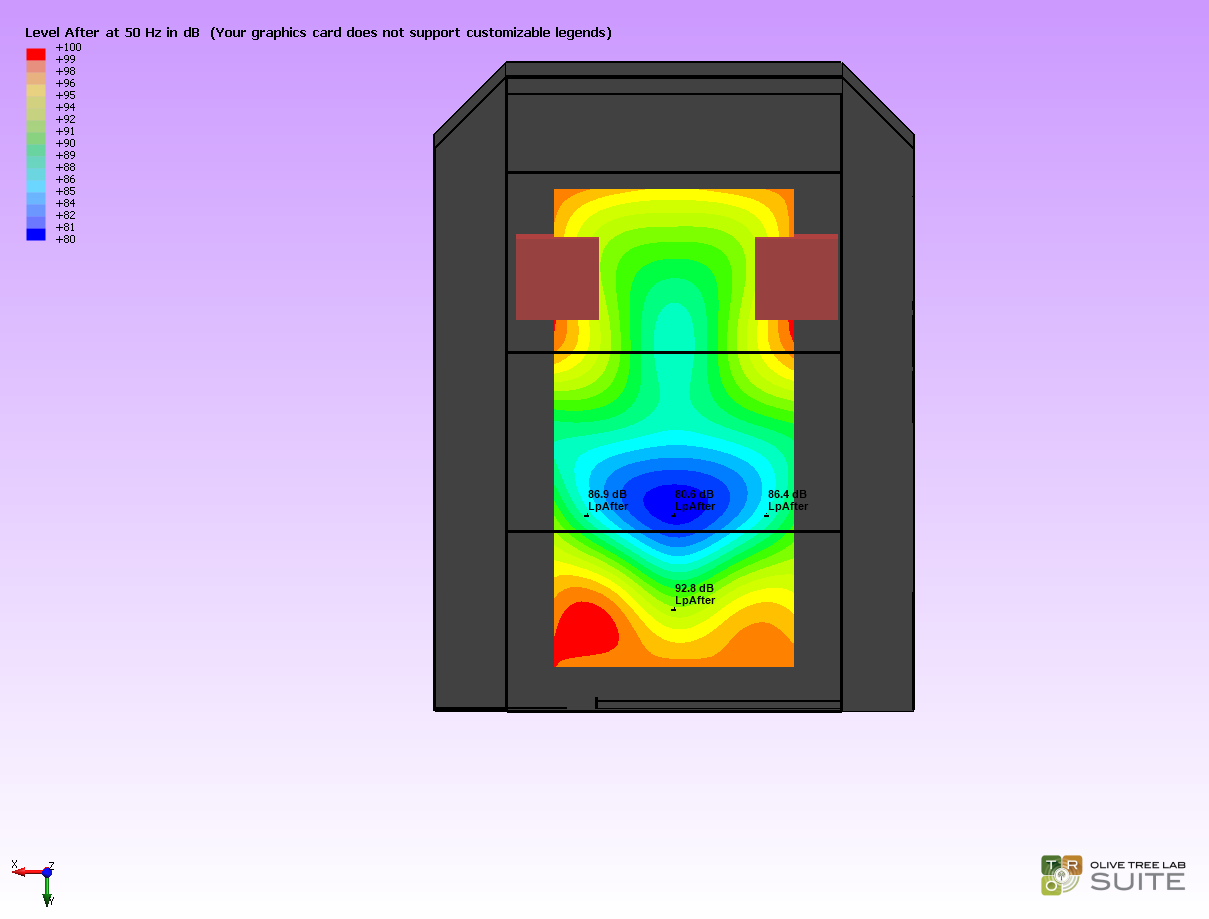
To get a further insight to the difference in the SPL at the seating positions, identical spatial points have been marked out on all the set ups. In the left figure, we can see that the seating area has just narrowly missed a mode. However, it is not so fortunate at 50Hz- the centre seating position is smacked right in the middle of the quietest location of the mode. Compared to a position just behind the seating area, the difference in the SPL is about 12dB. (Usually a difference in 3dB will be audible to most people, it is possible for trained listeners to tell a 1-2dB difference).
How to determine the best speakers?
At 50Hz, this 12dB dip will be obvious and measures should be taken to reduce this effect. This can be done by implementing membrane bass traps tuned to this specific frequency. It is then placed at an optimal position in the room. Check out point #4 from our earlier post on home theatre designs for some ideas and further explanation. Analysis of the results allow us to appropriately cater to the room’s needs.
Utilising simulation tools like Olive Tree Lab and Ease, it is possible to determine the best speaker and listening positions. Furthermore, we can tailor the absorption and diffusion for optimal performance before investing in the materials. Following which, we can proceed with the physical layout of the room.
Bonus
Tell us what you think about the post or ask us about acoustic simulations in the comments below. If you would like to consult us regarding a room simulation, please do not hesitate to contact us.